Propensity distribution
Propensity Distribution is the distribution of users in the decile buckets and also in categories of high, medium, and low with respect to the propensity.
Decile buckets (1-10%, 11-20% etc.) of propensity shows the user count in the respective propensity range. Distribution by category shows the high (propensity > 70%), mid (propensity 40-70%), and low (propensity < 30%) propensity respectively.
For example, if a user purchases an item the propensity is 70%, if a user has items in the cart then propensity is 40% and if the user has no items in the cart or has not viewed any products propensity is 10%
Click on the download button to download this information in a chart or CSV file.

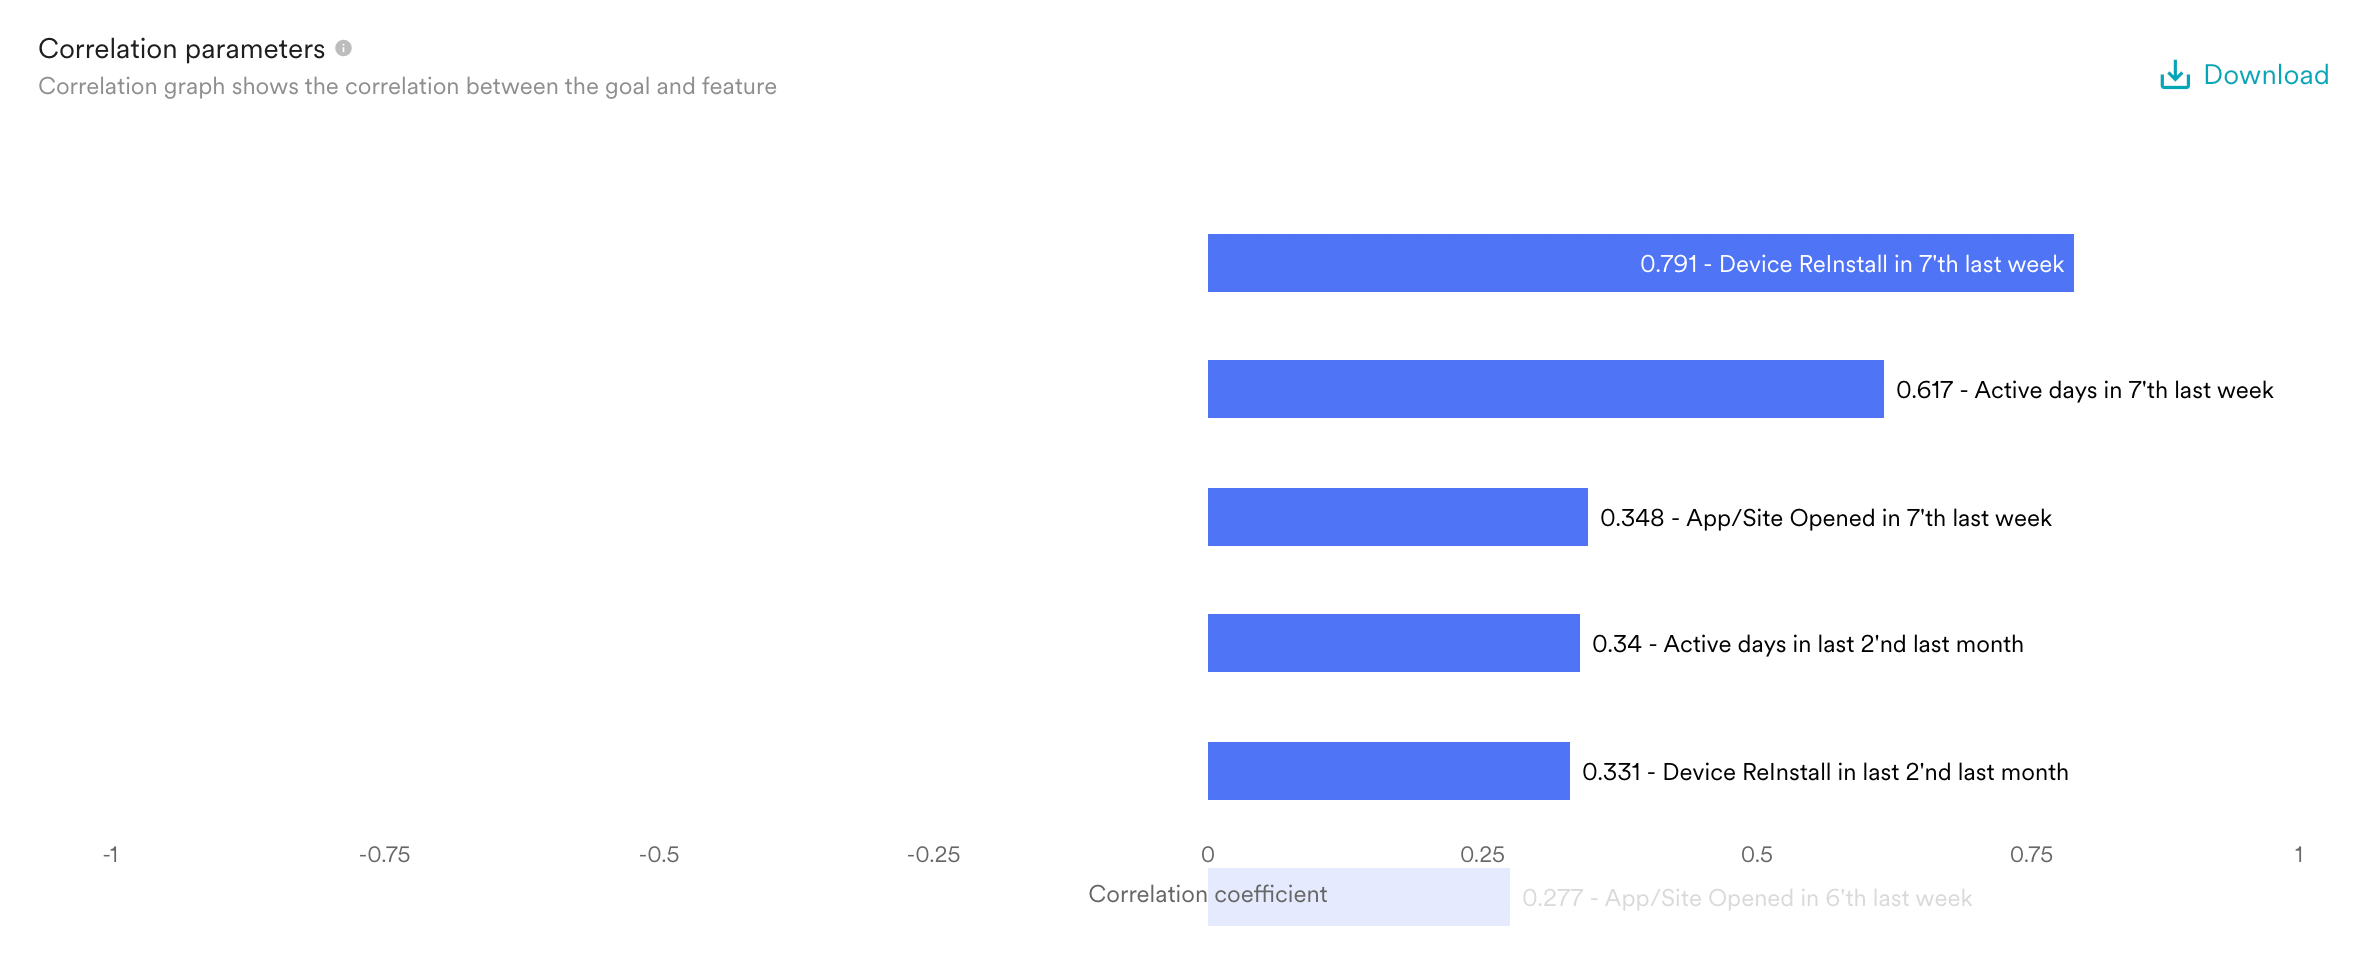
Correlation parameters
Correlation is the measure of the strength of the linear relationship between correlation parameters and predictions. An increase in the positive correlation parameter increases the probability of predicted action or no action. An increase in the negative correlation parameter decreases the probability of predicted action or no action.
For example, when items are added to the cart, the action is positive.
Click on the download button to download this information in a chart or CSV file.

The table defines the parameters used in the model which can be seen in the correlation chart.
|
Time Period |
Description |
Label |
|---|---|---|
|
Current Week-1 |
The most recent week i.e. the last 7 days from model run time |
<<event name>> - Week 1 |
|
Current Week-2 |
Time period pertaining to 7-14 days from model run time |
<<event name>> - Week 2 |
|
Current Week-3 |
Time period pertaining to 15-21 days from model run time |
<<event name>> - Week 3 |
|
Current Week-4 |
Time period pertaining to 22-28 days from model run time |
<<event name>> - Week 4 |
|
Current Week-5 |
Time period pertaining to 29-35 days from model run time |
<<event name>> - Week 5 |
|
Current Week-6 |
Time period pertaining to 36-42 days from model run time |
<<event name>> - Week 6 |
|
Current Week-7 |
Time period pertaining to 43-49 days from model run time |
<<event name>> - Week 7 |
|
Current Week-8 |
Time period pertaining to 50-56 days from model run time |
<<event name>> - Week 8 |
|
Current Month-1 |
The most recent month i.e. the last 30 days from the model run time |
<<event name>> - Week 9 |
|
Current Month-2 |
Time period pertaining to 30-56 days from model run time |
<<event name>> - Week 10 |
Instance Details
Select Prediction Details for instance to display specific details about the prediction instance. Details such as
- User segment for which the prediction is performed
- Definition of prediction
- User attribute and custom segments where the results are saved
- Forecast period
- Lookback duration (data analysis duration)
- Prediction start and end time.
